
Earlier this year I started generating software based on research papers and datasets. I did it for a few months and stopped. I think it’s an interesting way to build software, but I was uncomfortable with some of the projects I was attempting to build. It feels reckless to not understand the architecture and domain, so I moved on from most of them.
One of the projects I started in the spring using this practice is planetarium software. I enjoy astronomy and thought this was a good way to start understanding the math and science more deeply. I’m taking that project slowly.
While working on the planetarium, I ran into a problem. I put a constraint on myself to only use openly available scientific data, and I couldn’t trace the license of the moon texture I was using. Instead of finding another moon texture, I opted to do the more interesting thing. I wanted to render the moon using only data from spacecraft. A few hours of generating code and using deep research later, I got the moon working and it was beautiful.
I’m still working on the planetarium software, but I wanted to share what I did with the moon. Last week, I started a new project that took some of the ideas and turned them into a standalone moon renderer, and I was able to use a much richer dataset.
To be clear: I’ve been building software for 25 years, but I will not claim that I understand this implementation beyond the things that were interesting to me. I do understand many of the high-level patterns and can comfortably dig into most of the codebase, and I enjoy reading documentation and the referenced papers to understand the inner workings.
What I built
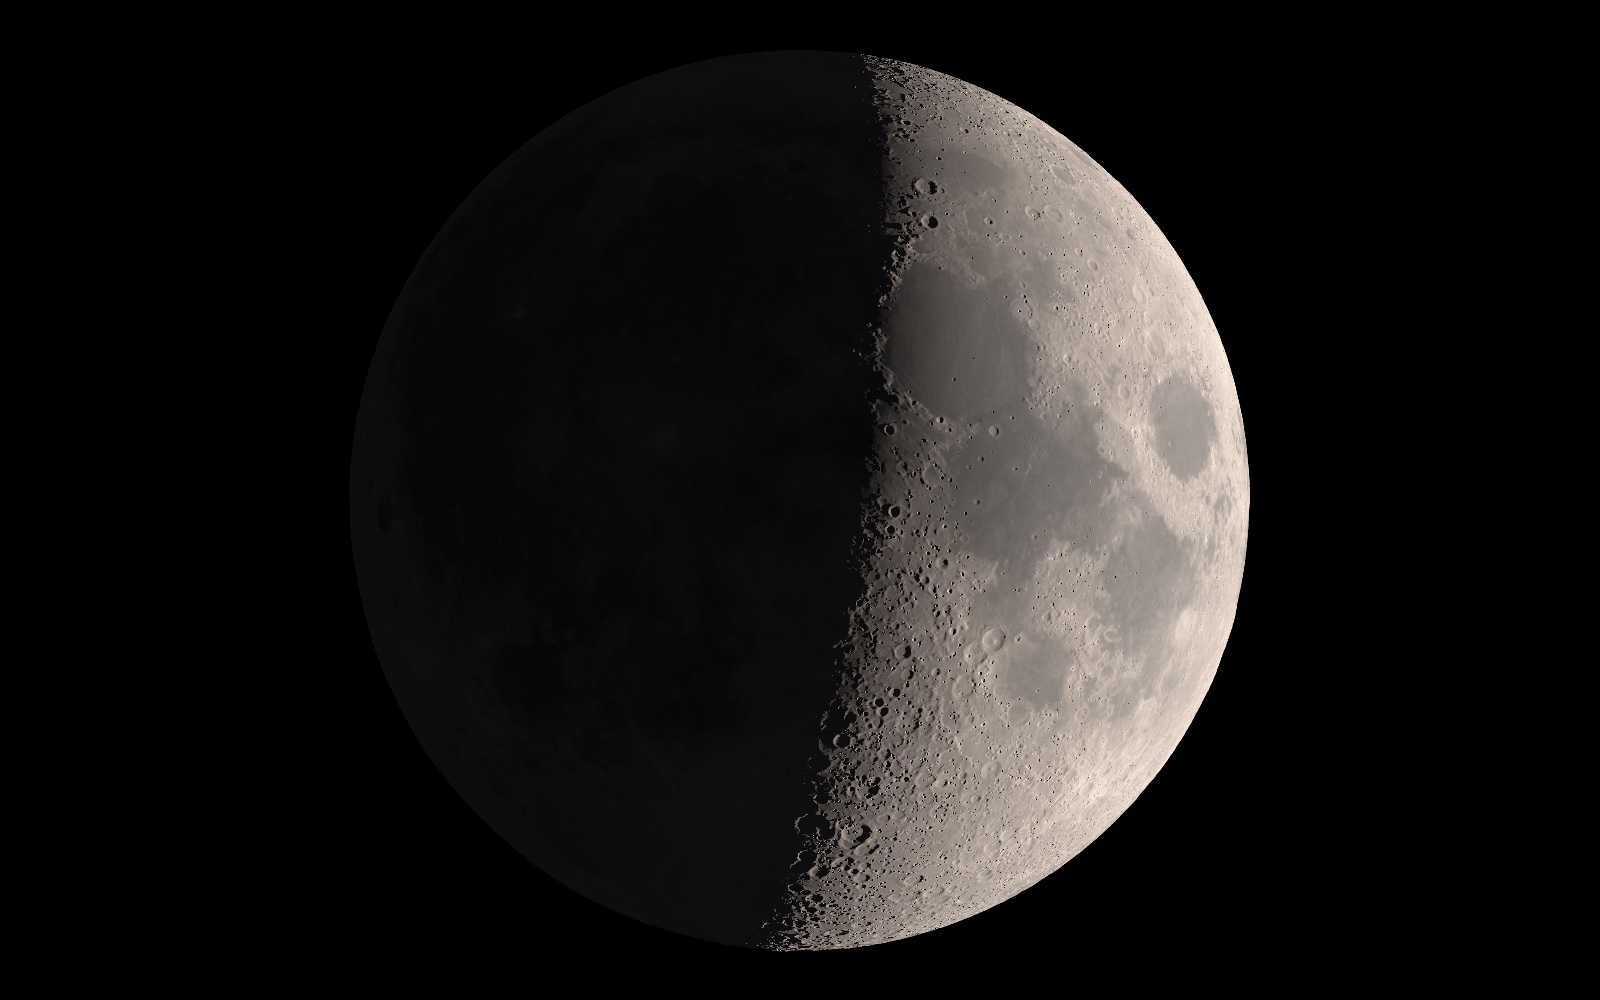
The moon on moon.tomkrush.com is drawn entirely from spacecraft measurements. NASA’s Lunar Reconnaissance Orbiter has been circling the moon since 2009, and one of its instruments is a laser that measures the height of the surface. The same laser also measures how much light bounces back, which tells you how bright the ground is. I combined that with a catalog of about 1.3 million craters and a model of how sunlight scatters off lunar dust. Then I put the Sun, Earth and Moon where they really are, and the renderer works out what you should see.
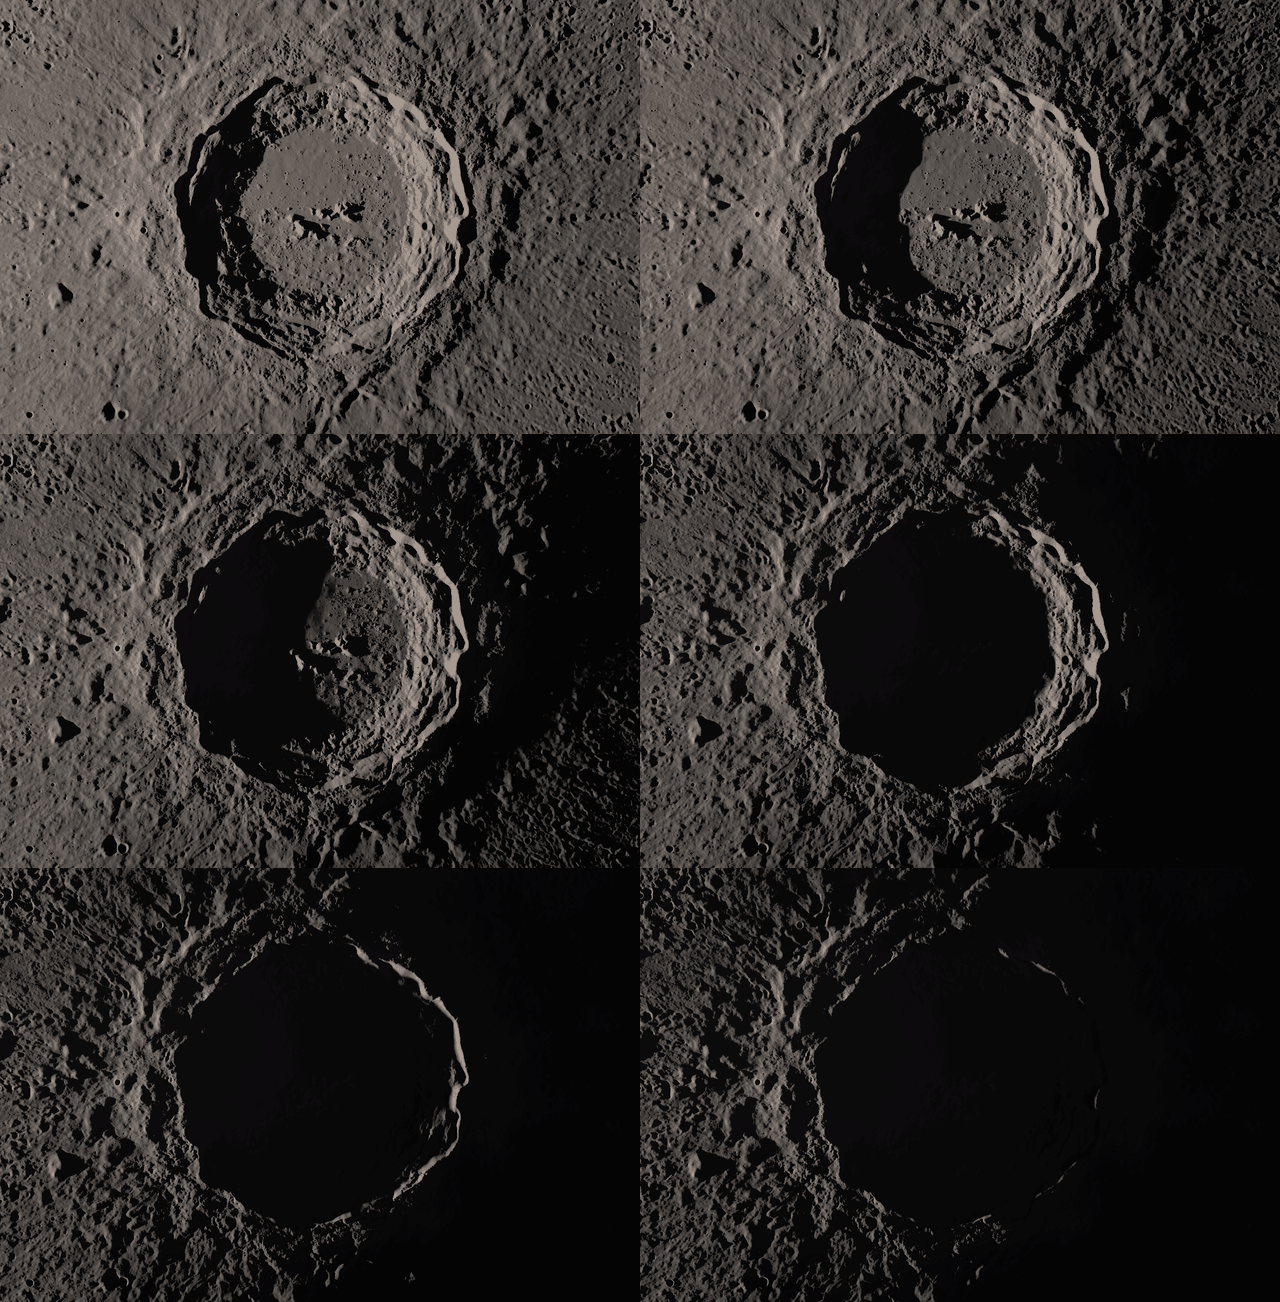
When you open the page, it shows the moon as it looks right now. You can speed up time and watch the shadows move across the craters, or leave Earth and fly down close to the surface. Watching time pass while looking at the mountains near the shadows is stunning on a large screen.
Why a separate project
In the planetarium, the moon is one small thing in a sky full of stars and planets, so I took a lot of shortcuts. It’s basically a flat disc that’s shaded to look round, and it only draws the largest craters. That works when the moon is small on the screen.
In this project, I wanted to share the moon. We all see it at night, and there is so much data on it.
Getting it on the web
The most detailed elevation data for the moon is about 66 GB, and that’s before the brightness data and the crater catalog. The early versions had the browser downloading hundreds of megabytes, and my MacBook stayed hot. After several iterations, I got the moon split into 288 pieces, with tiles for the closer zoom levels, so you only download a few megabytes at a time and it stays responsive at any zoom.
I had the agent preprocess everything ahead of time into small packages. The page only downloads the pieces you can see, plus a few nearby ones that cast shadows into view. The far side never downloads if you’re looking from Earth. On a phone, the whole moon is about 5 MB, and on a laptop it’s about 12 MB. As you pan and zoom, it downloads more.
I also pushed the agent towards storing differences. Each piece has a low-detail version, and the extra detail is stored as only the difference from it, so you only download the detail your screen can show. Zooming in works the same way: each closer level is stored as the difference from the level above it. The 66 GB of close-up data became 13 GB of small tiles, and you only download the few you’re looking at.
Validating results
I’ve been using reference images to manually compare craters and lighting, and to my eye it looks correct. For automated testing, I had the overall brightness checked against the model scientists use to calibrate satellites against the moon, and the surface checked against real photos from the orbiter’s camera. I’m still working through the results of validation. I know brightness still needs to be tuned further. The AI made some assumptions on values that I need to work out.
Why I’m sharing this one
I think building software using openly available scientific data is enjoyable. I think projects like this are a way to celebrate the people who push science forward.
If you want to try it, go to moon.tomkrush.com. It needs a recent version of Chrome, Edge or Safari. I’ve tested on several Macs, iPhones and iPads. I also tested on a ThinkPad from a few years ago.
I haven’t posted the repo to GitHub yet. If you find issues, send them to tom@tomkrush.com. I would be happy to dig into what is found.